ThinkBoard: Data Analytics Dashboard
Project Overview
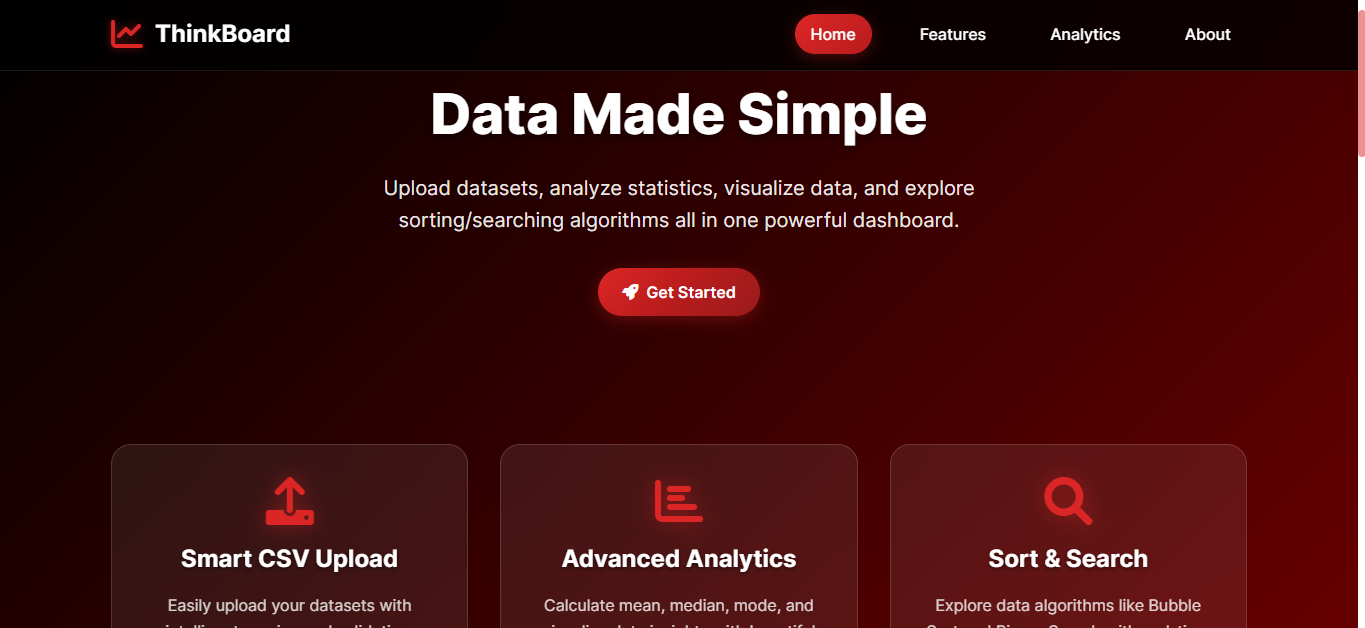
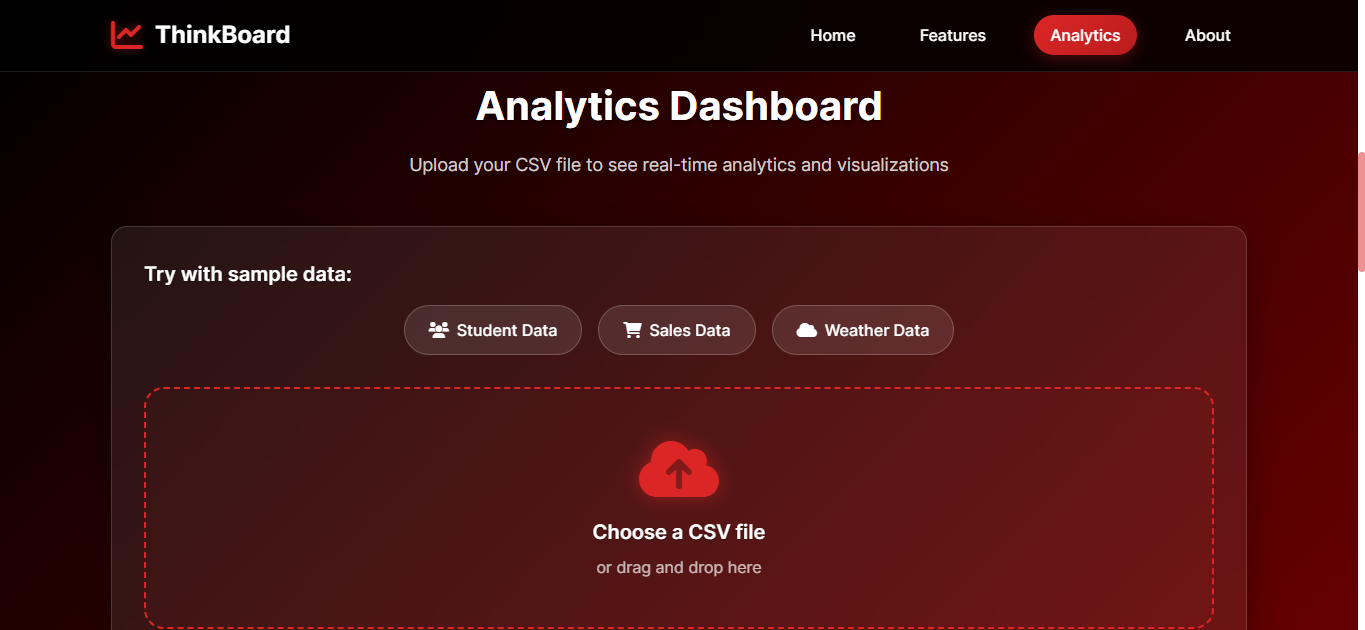
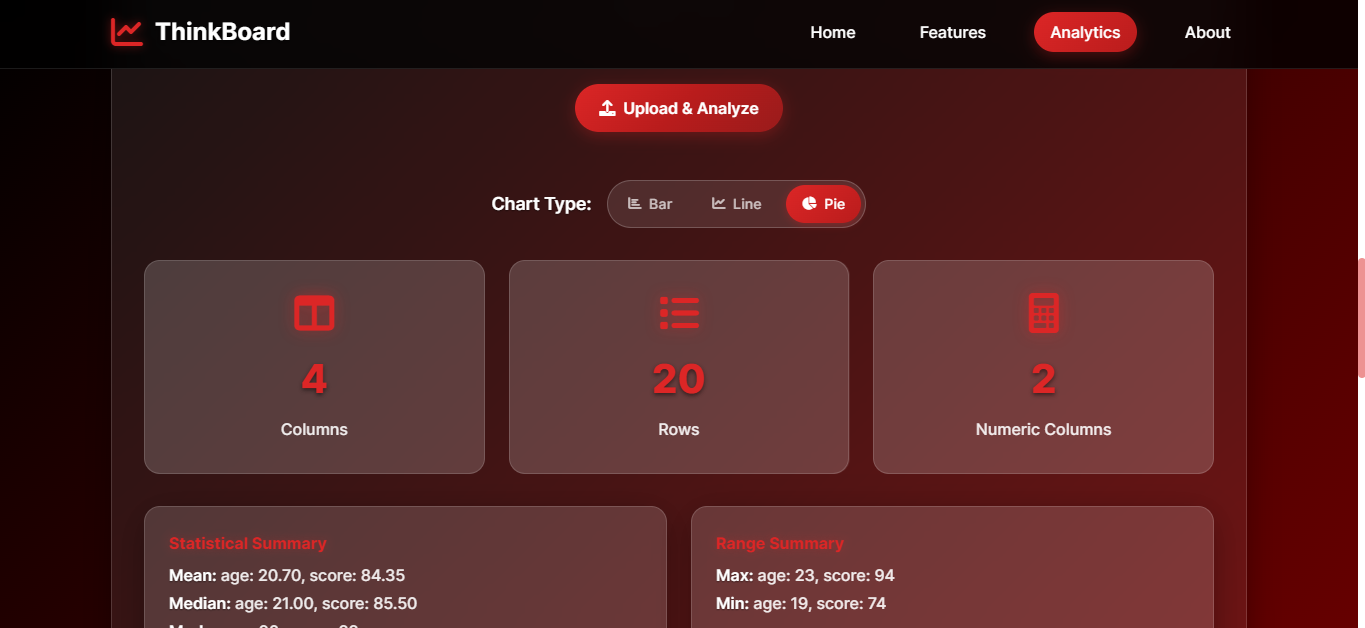
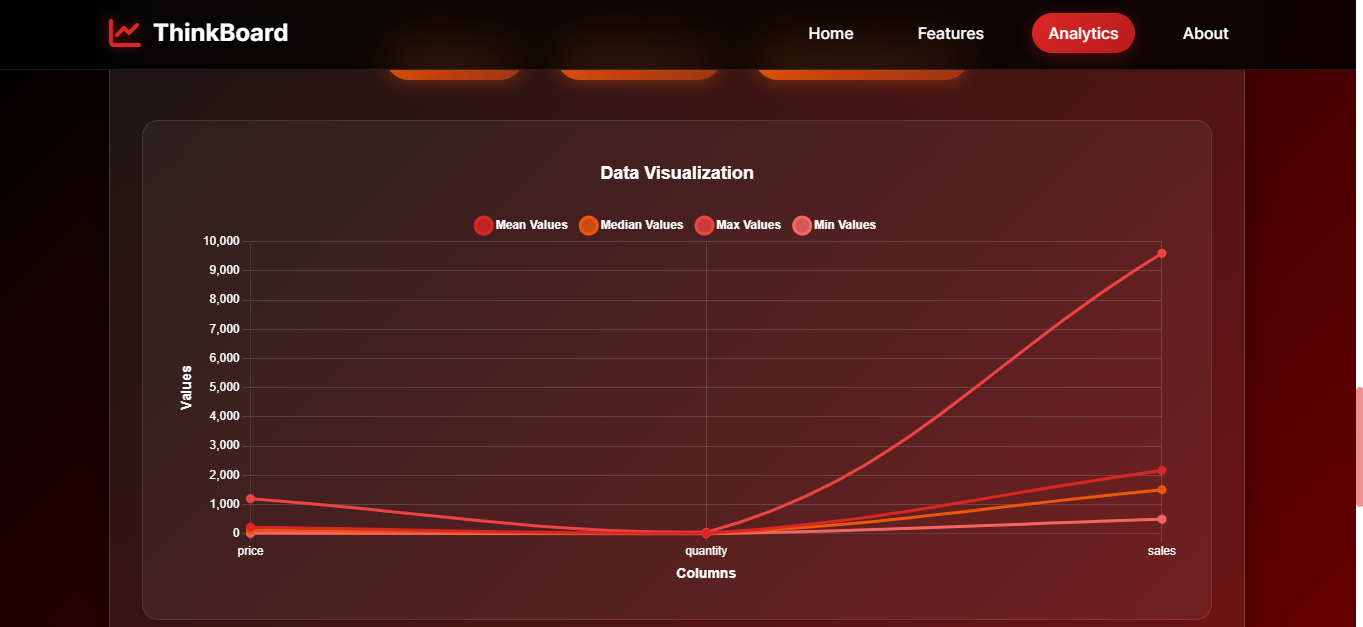
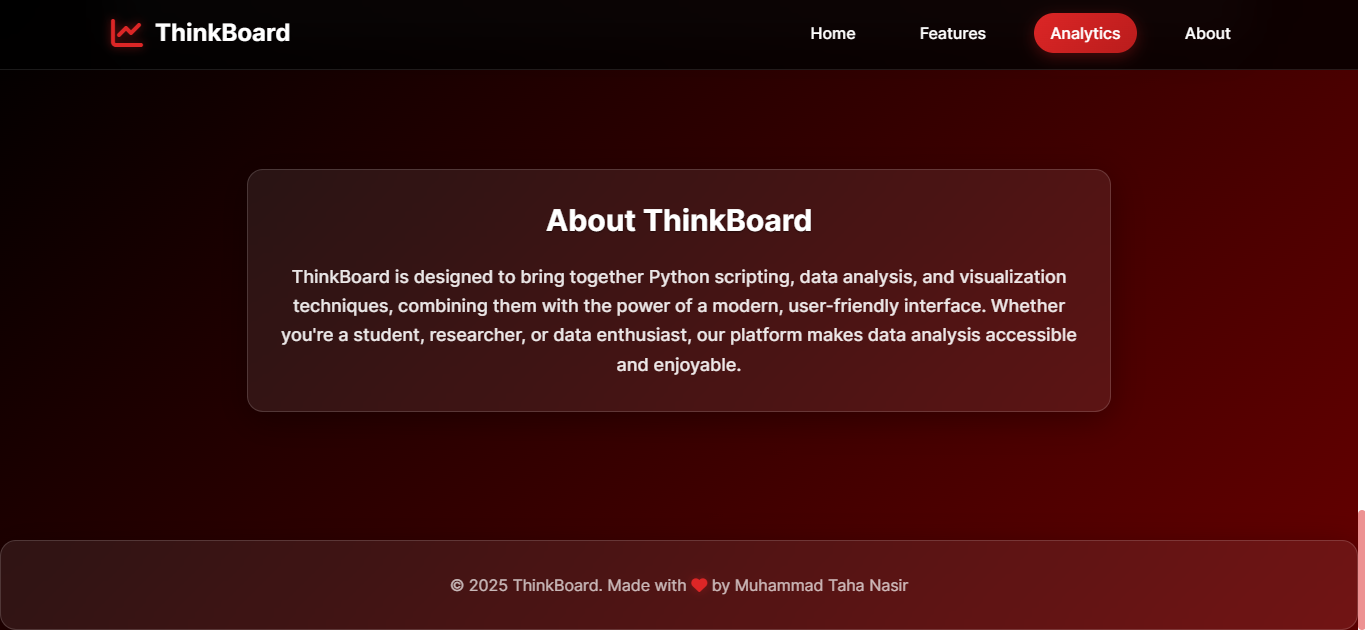
ThinkBoard is a Flask-based web application designed for data analysis and visualization. Users can upload CSV files, compute statistical metrics such as mean, median, and mode, and generate interactive charts, including bar, line, and pie formats. The application features a modern glassmorphism design with a dark theme and is fully responsive for both desktop and mobile devices.
Situation
Data analysts and enthusiasts often require accessible tools to upload, analyze, and visualize datasets without complex configurations. Existing solutions may lack intuitive interfaces or engaging designs, limiting their effectiveness for quick data exploration.
Task
The goal was to develop a web application using Flask and JavaScript that supports CSV file uploads, performs statistical analysis, and provides interactive data visualizations. The application needed a modern, user-friendly interface with glassmorphism styling and mobile responsiveness.
Actions
- Developed a Flask backend to manage CSV file uploads, data processing, and API endpoints.
- Utilized Pandas and NumPy for statistical computations and data manipulation.
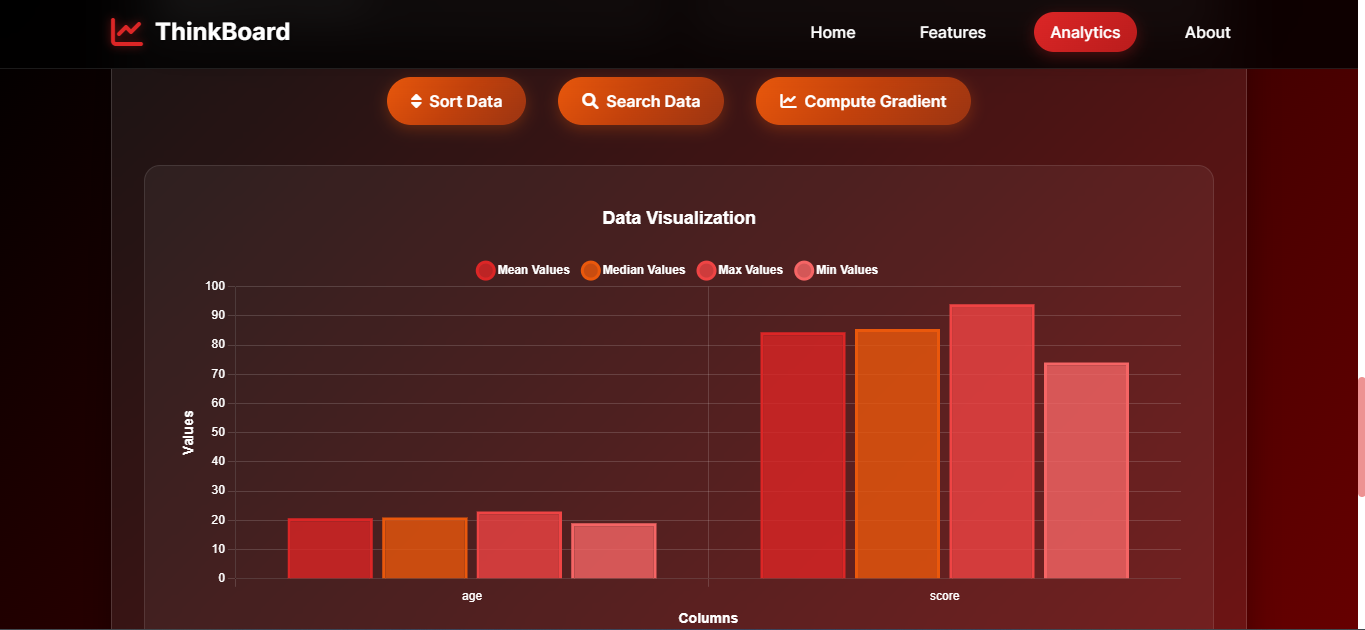
- Implemented a JavaScript frontend with Chart.js to create interactive bar, line, and pie charts.
- Designed a glassmorphism user interface using CSS3, featuring translucent cards, blur effects, and a dark theme.
- Ensured mobile responsiveness with a hamburger menu and touch-friendly controls.
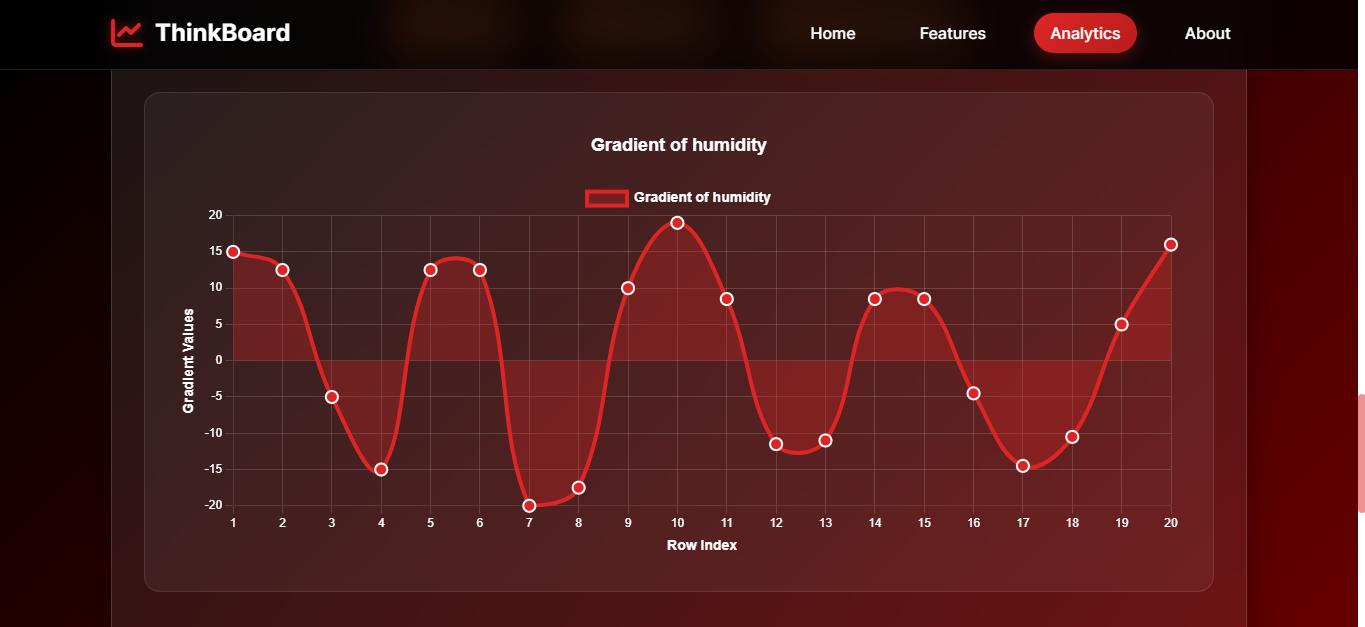
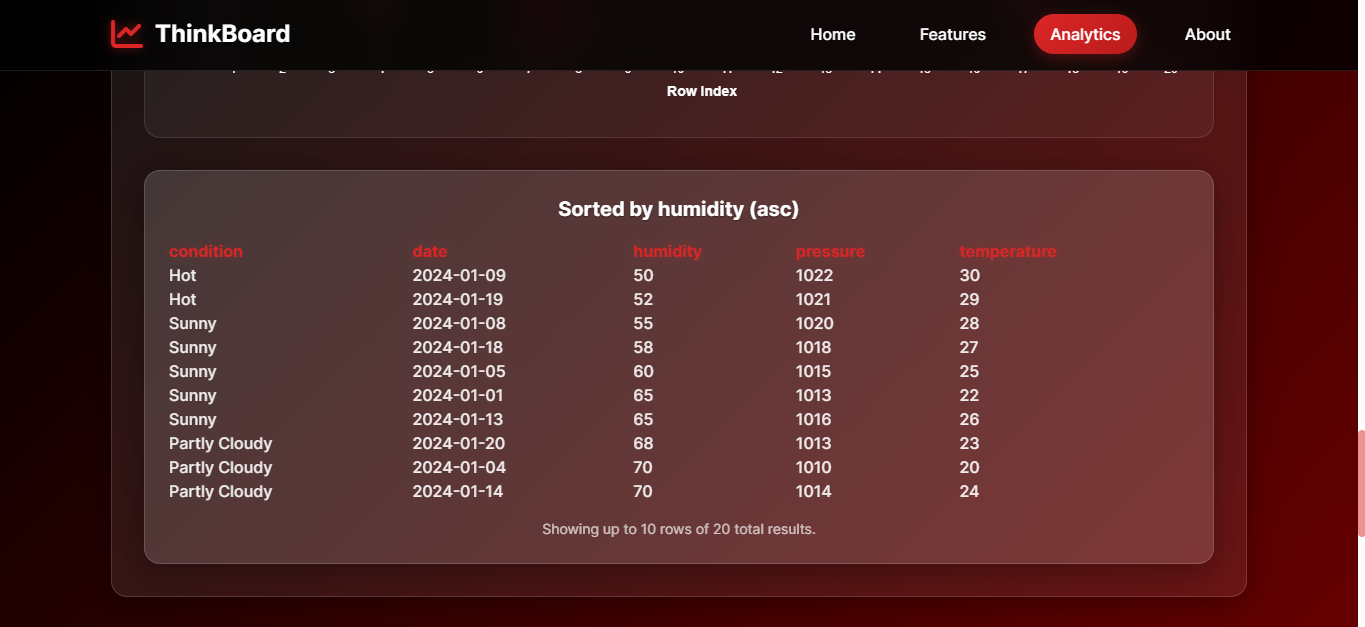
- Integrated sorting, searching, and gradient computation functionalities for enhanced data exploration.
- Deployed the application on Railway for public access.
Results
ThinkBoard provides an effective platform for data analysis, offering intuitive functionality and visually appealing charts. The project enhanced my expertise in full-stack web development, data processing, and user interface design. Its deployment on Railway ensures accessibility for users worldwide.
Tech Stack
- Flask: Python web framework for backend development.
- Pandas & NumPy: Libraries for data analysis and numerical computations.
- JavaScript: For interactive frontend functionality.
- Chart.js: For generating interactive data visualizations.
- HTML5 & CSS3: For semantic markup and modern styling.
- Flask-CORS: For managing cross-origin resource sharing.
- Railway: For cloud deployment.